This function is a wrapper of the ahist function
for plotting nicely the distribution of the MCC models' values.
plot_mcc_classes_hist(models.mcc, models.cluster.ids, num.of.mcc.classes)
Arguments
| models.mcc | a numeric vector of Matthews Correlation Coefficient (MCC) scores, one for each model. The names attribute may hold the models' names (but it is not required). |
|---|---|
| models.cluster.ids | a numeric vector of cluster ids assigned to each
model. It can be the result of using |
| num.of.mcc.classes | numeric. A positive integer (>2) that signifies the number of mcc classes (groups) that we should split the models MCC values. |
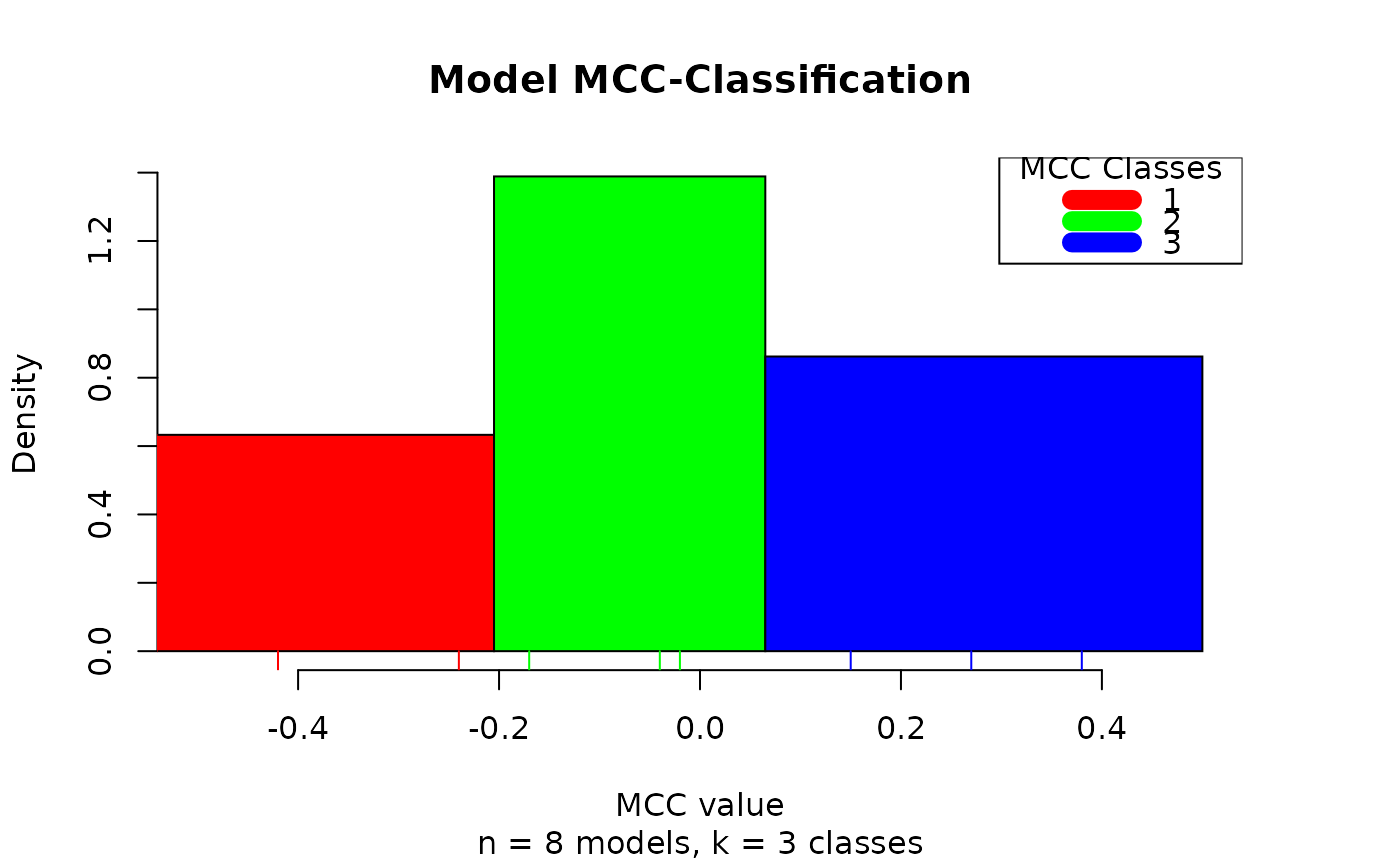
Examples
models.mcc = c(-0.04, -0.17, 0.15, -0.24, -0.02 , 0.27, -0.42 , 0.38) models.cluster.ids = c(2,2,3,1,2,3,1,3) num.of.mcc.classes = 3 plot_mcc_classes_hist(models.mcc, models.cluster.ids, num.of.mcc.classes)#> [1] TRUE